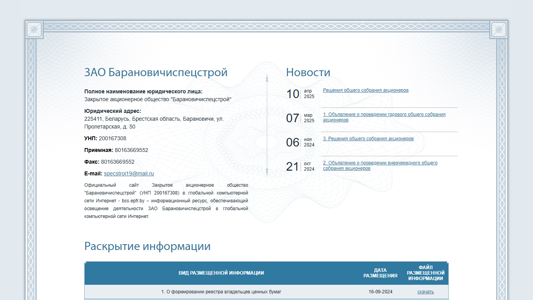
Барановичиспецстрой ЗАО
Сайт: bss.epfr.by — HTTP 200 (OK)
| УНП | 200167308 |
|---|---|
| Название / Заголовок | Барановичиспецстрой ЗАО |
| Телефон | +375162219765, +375163669552 |
| specstroi19@mail.ru, 416619@tut.by | |
| Адрес | ул. Пролетарская, д. 50 |
| Обновлено | 2025-10-01 16:43:14.273717+00 |
| IP адрес | 178.159.242.146 |
| Проверка IP | 2025-10-01 16:43:10.536261+00 |
| AI-анализ | --- The website <bss.epfr.by> is the official online platform of ZAO (Closed Joint-Stock Company) "Барановичиспецстрой" (UNP 200167308). It provides information on the company's activities in the global computer network Internet. The site contains announcements of shareholders' meetings, including minutes of past meetings, and downloadable reports and auditor's conclusions. The most frequently used keywords on the site include "download," "common," "meetings," "shareholders," "formation," "registry," "owners," "valuable," "papers," "annual," "report," "auditor's conclusion," and "announcement." The site also offers forms for share registration and contact information, including a phone number, fax, and email address. |
| SEO-лексика | скачать общего собрания акционеров формировании реестра владельцев ценных бумаг годовой отчет аудиторское заключение объявление проведении 2023 барановичиспецстрой решения зао мар |
| Безопасность | hsts: ❌, csp: ❌, x_frame: ❌, x_content_type: ❌, re...hsts: ❌, csp: ❌, x_frame: ❌, x_content_type: ❌, referrer_policy: ❌ |
| Доступность | basic: {"missing_alts":33,"empty_links":4}, extend...basic: {"missing_alts":33,"empty_links":4}, extended: {"missing_alts":33,"empty_links":4,"aria_attributes":0} |
| Технологии сайта | Google Analytics, jQuery |
| Кодировка | utf-8 |
| AI-качество | 1 |
| Robots.txt | Открыть robots.txtUser-agent: * Disallow: /files/ User-agent: Yandex Disallow: /files/ Host: trast-zapad.by Sitemap: http://trast-zapad.by/sitemap.xml |
| Sitemap | ✅ Есть |
| QR / Короткая ссылка |  niti.by/qiaA |

